$ 19.99
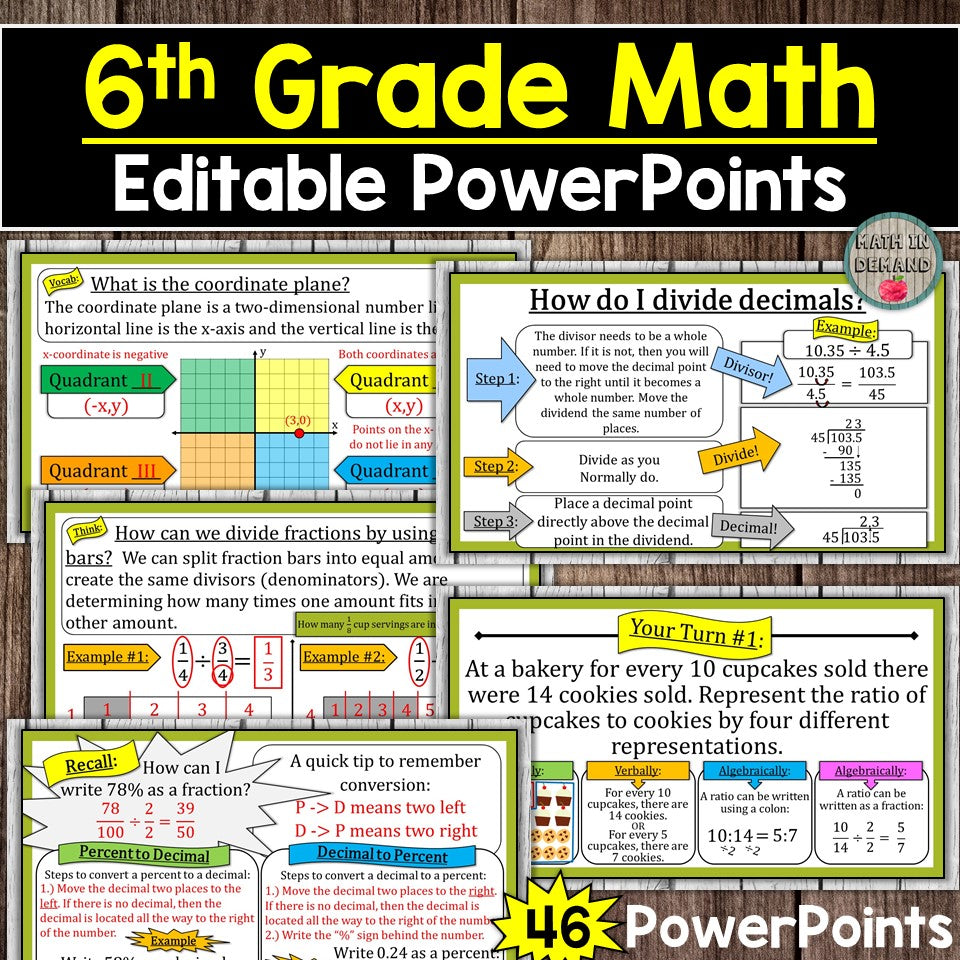
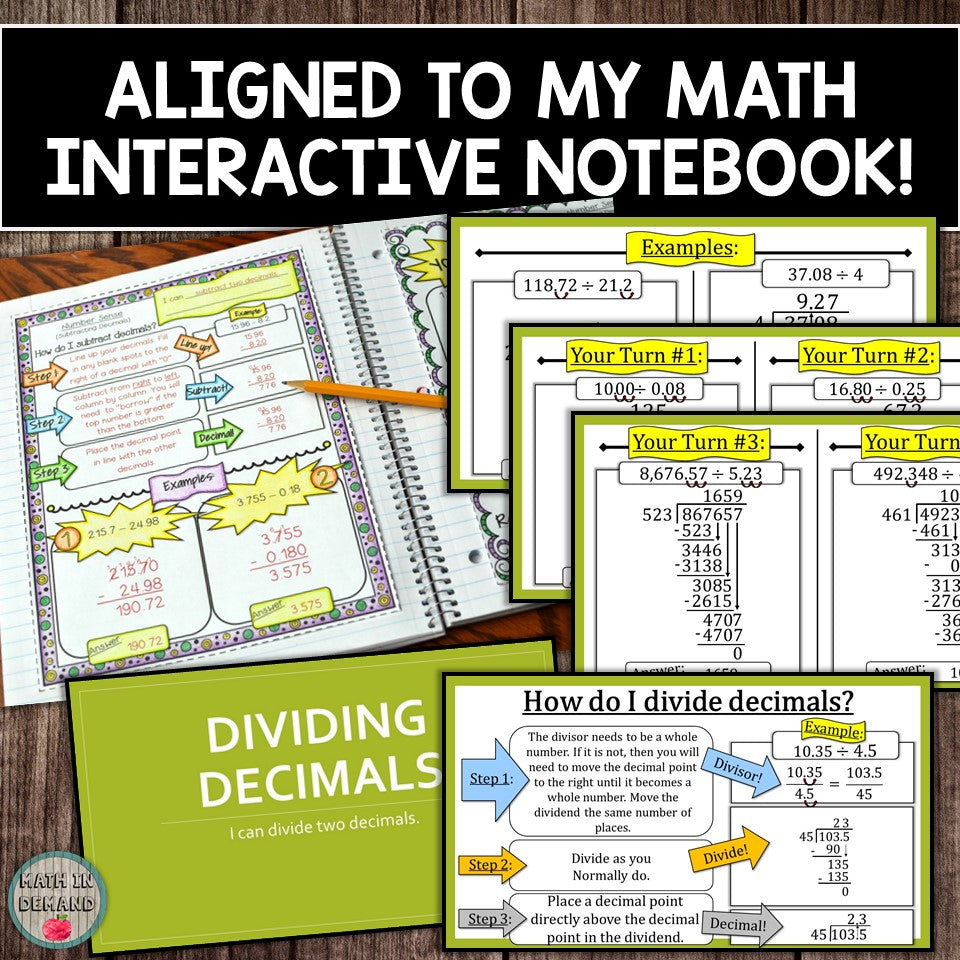
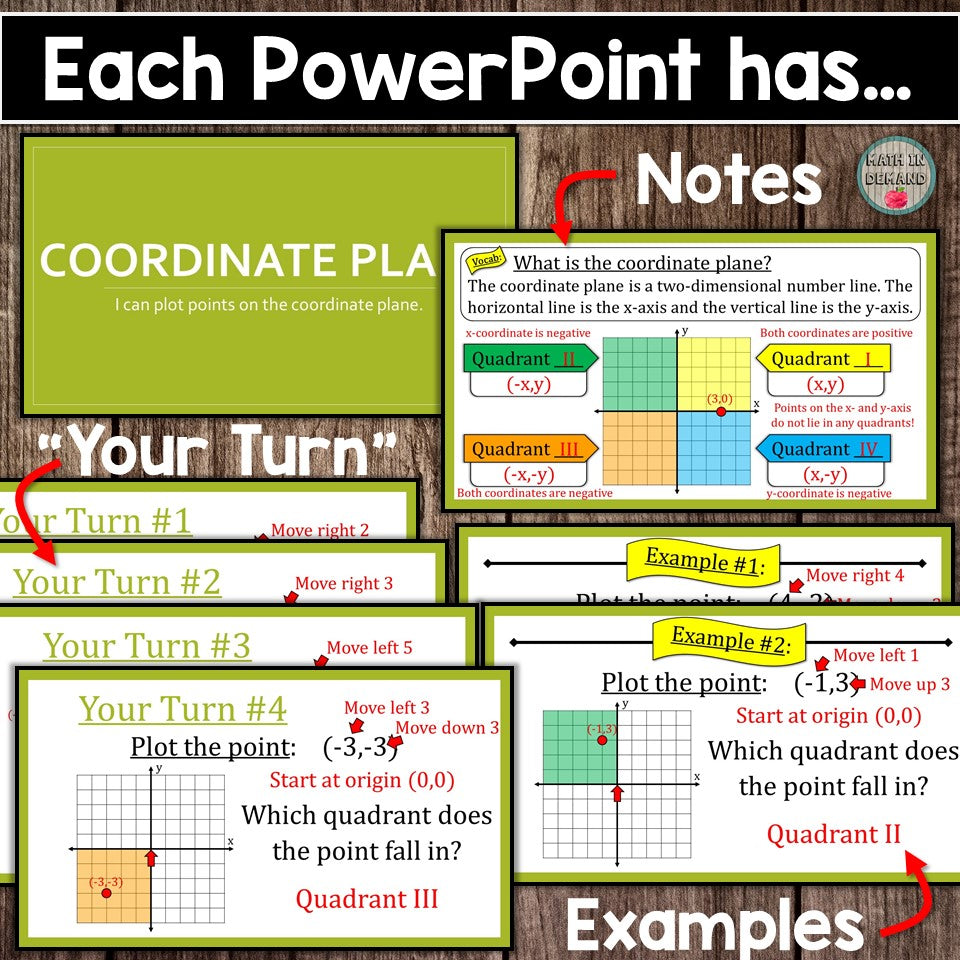
These PowerPoints are perfect for any 6th Grade Math classroom! There is an entire years worth of PowerPoints that are editable! In addition, each PowerPoint includes animations! All you need to do is open the PowerPoint and click F5 to start the PowerPoint! There is a total of 47 PowerPoints. Each PowerPoint is aligned to my popular 6th Grade Math Interactive Notebook! You can use the PowerPoints without the notebook. However, the notebook aligns the PowerPoints perfectly and is super easy for students to stay organized!
The PowerPoints Include:
Unit 1 - Number Sense
✅ Adding Decimals
✅ Subtracting Decimals
✅ Multiplying Decimals
✅ Dividing Decimals
✅ Dividing Fractions with Fraction Bars
✅ Dividing Fractions
✅ Word Problems involving Dividing Fractions
✅ Exponents
✅ Order of Operations
✅ Intro to Negative Numbers & Comparing Negative Numbers
✅ Positive and Negative Numbers
✅ Number Opposites
✅ Absolute Value
✅ Coordinate Plane
✅ Distance between Points with a Same Coordinate
✅ Least Common Multiple
✅ Greatest Common Factor
Unit 2 - Ratios, Rates, & Percentages
✅ Intro to Ratios & Word Problems
✅ Intro to Rates & Word Problems
✅ Intro to Percents
✅ Percent-Decimal Conversions
✅ Finding the Part (Percent of a Number - Finding an Amount)
✅ Finding the Rate
✅ Finding the Base
Unit 3 - Expressions & Equations
✅ Intro to Variables
✅ Evaluating Expressions
✅ Writing Algebraic Expressions
✅ Solving One-Step Equations
✅ Intro to Inequalities
✅ Solving One-Step Inequalities
✅ Dependent vs Independent Variables
✅ Combining Like Terms
✅ The Distributive Property
✅ Writing Equivalent Expressions
Unit 4 - Geometry
✅ Area of Parallelograms
✅ Area of Triangles
✅ Area of Trapezoids
✅ Area of Composite Figures
✅ Identifying Parts of 3-Dimensional Objects
✅ Volume of Rectangular Prisms (Fractional Lengths)
✅ Surface Area using Nets
✅ Polygons in the Coordinate Plane
Unit 5 - Statistics & Probability
✅ Dot Plots & Frequency Tables
✅ Histograms
✅ Mean, Median, Mode, and Range
✅ Mean Absolute Deviation (MAD)
✅ Box Plots (includes IQR)