

$ 39.99
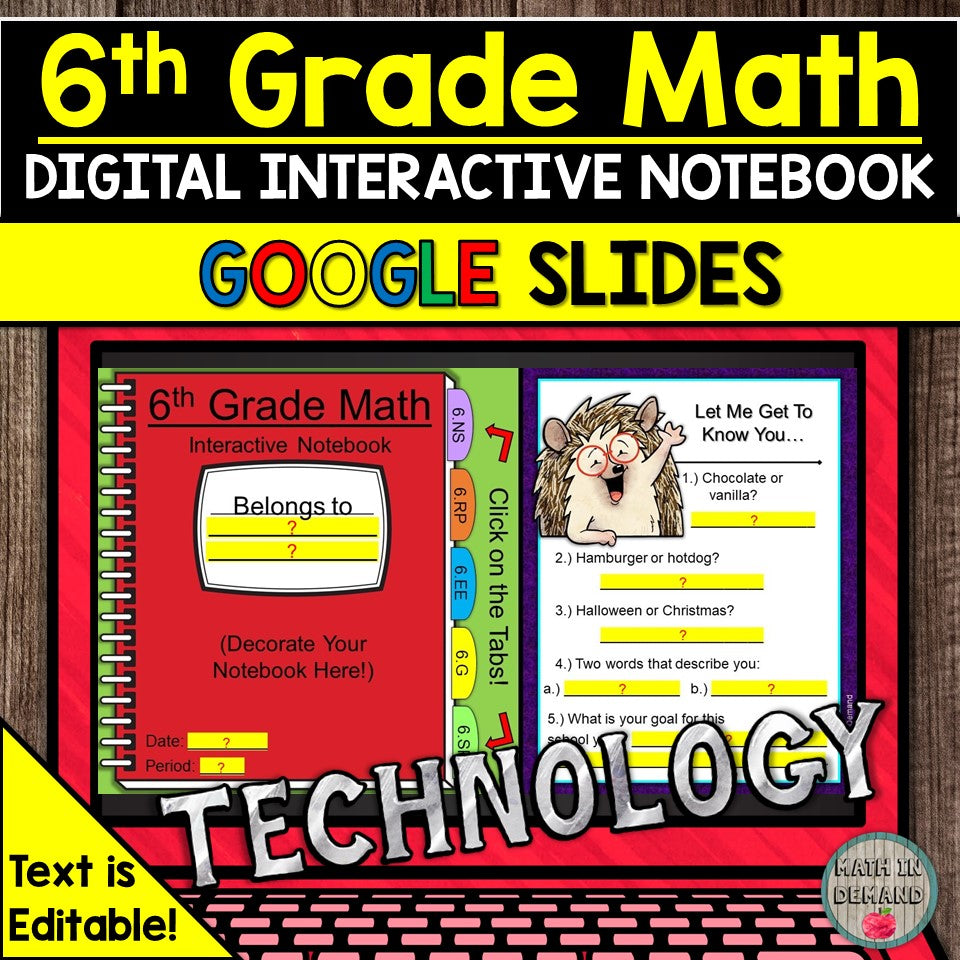
This is a for my 6th Grade Math Interactive Notebook. The notebook is 100% digital and is provided in PowerPoint and Google Slides. There are 3 Google Slides Links: (1) Background is embedded and 100% ready for the students, and (2) Editable Answer Key, and (3) Editable Student Edition. There are also 2 editable PowerPoints: (1) Editable Answer Key and (2) Editable Student Edition. You will be able to EDIT the text and add images. You can also delete pages and add pages.
Check out all of the math concepts that are included below:
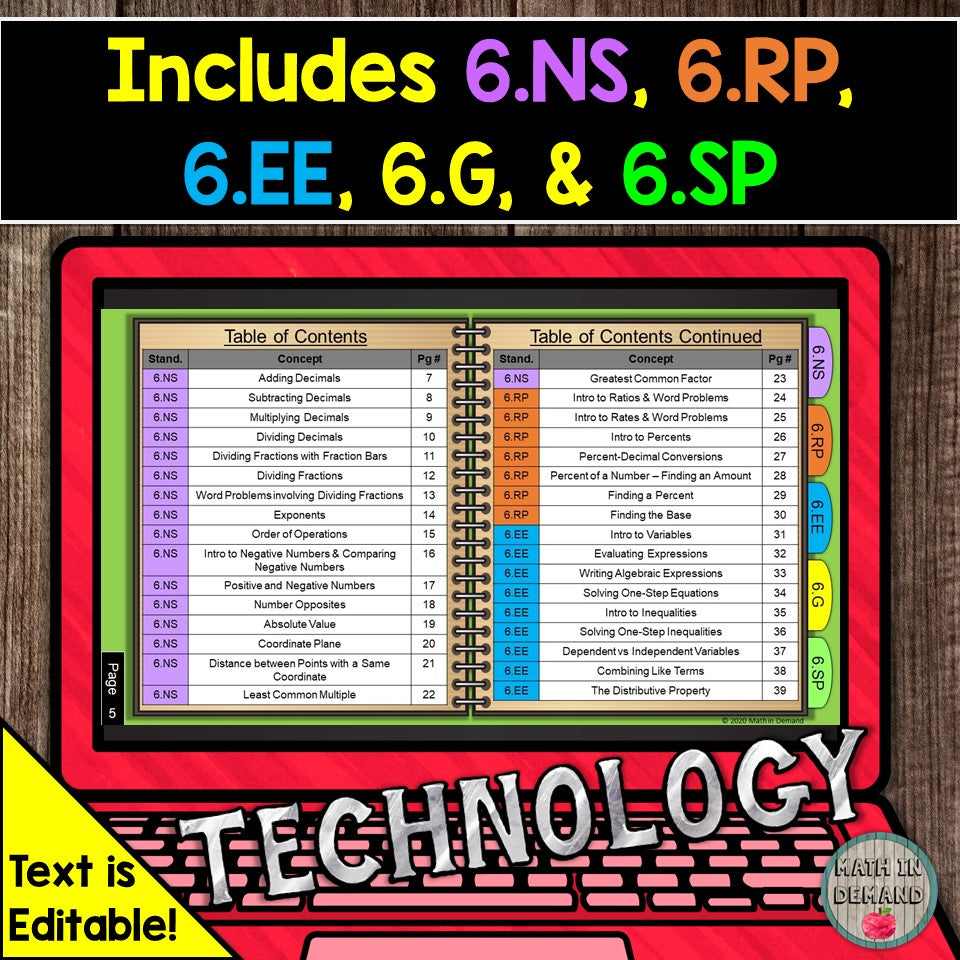
Unit 1 - Number Sense
1.) Adding Decimals
2.) Subtracting Decimals
3.) Multiplying Decimals
4.) Dividing Decimals
5.) Dividing Fractions with Fraction Bars
6.) Dividing Fractions
7.) Word Problems involving Dividing Fractions
8.) Exponents
9.) Order of Operations
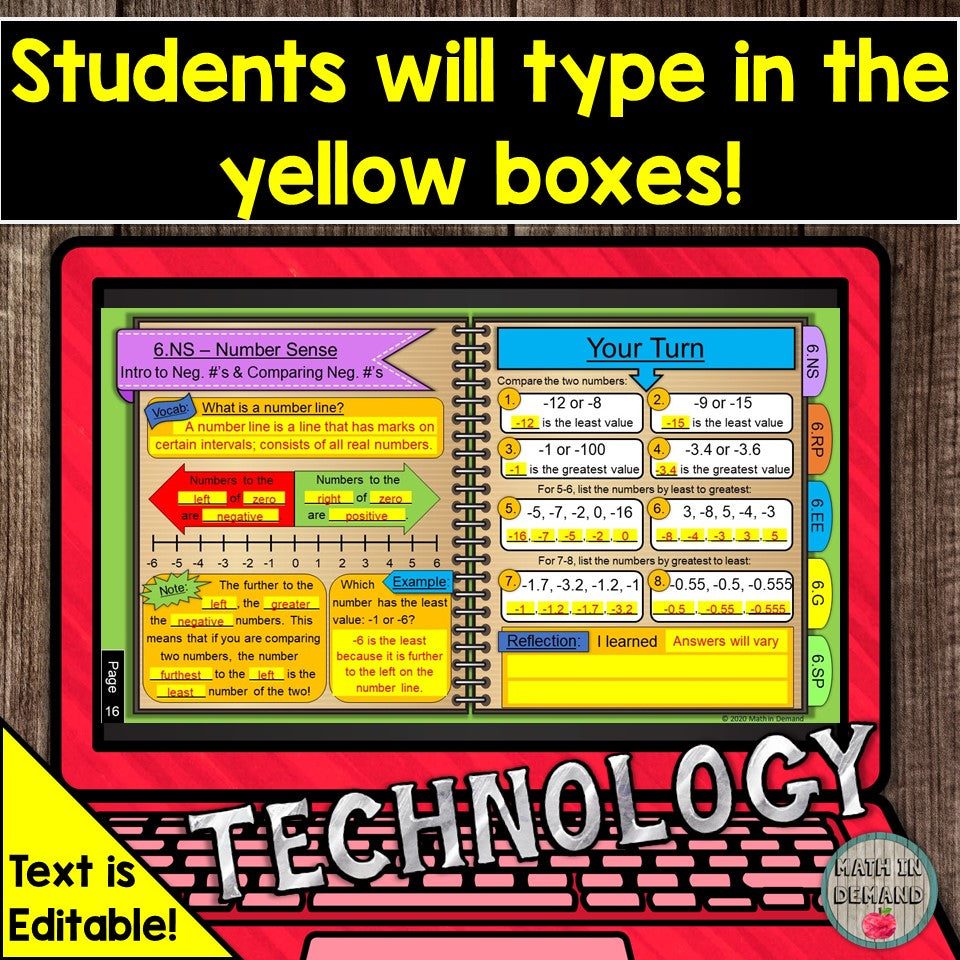
10.) Intro to Negative Numbers & Comparing Negative Numbers
11.) Positive and Negative Numbers
12.) Number Opposites
13.) Absolute Value
14.) Coordinate Plane
15.) Distance between Points with a Same Coordinate
16.) Least Common Multiple
17.) Greatest Common Factor
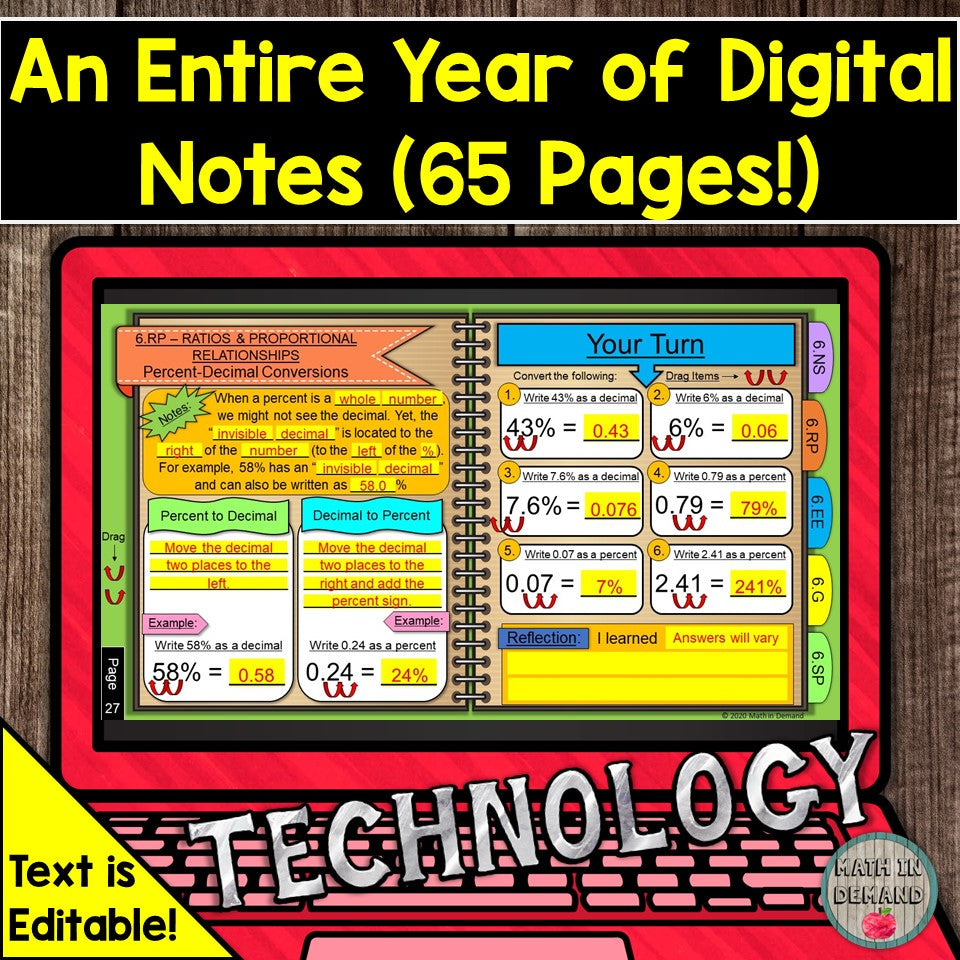
Unit 2 - Ratios & Proportional Relationships
1.) Intro to Ratios & Word Problems
2.) Intro to Rates & Word Problems
3.) Intro to Percents
4.) Percent-Decimal Conversions
5.) Percent of a Number – Finding an Amount
6.) Finding a Percent
7.) Finding the Base
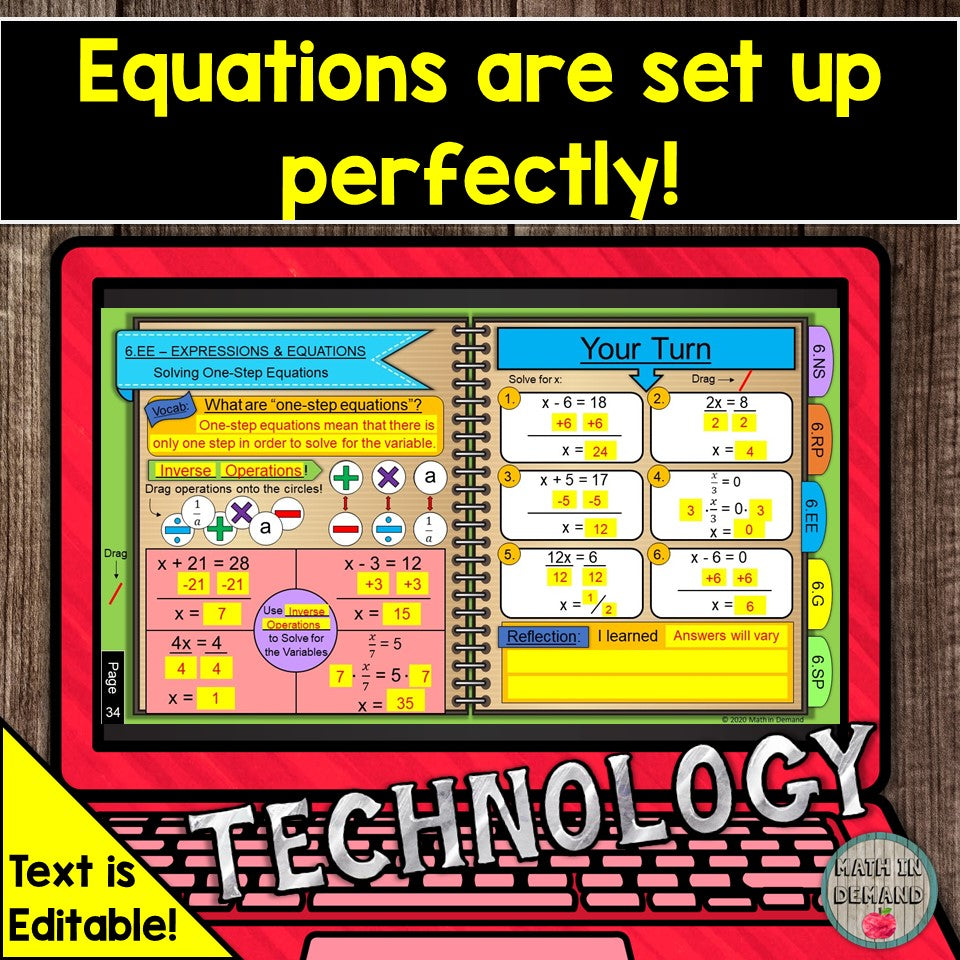
Unit 3 - Expressions & Equations
1.) Intro to Variables
2.) Evaluating Expressions
3.) Writing Algebraic Expressions
4.) Solving One-Step Equations
5.) Intro to Inequalities
6.) Solving One-Step Inequalities
7.) Dependent vs Independent Variables
8.) Combining Like Terms
9.) The Distributive Property
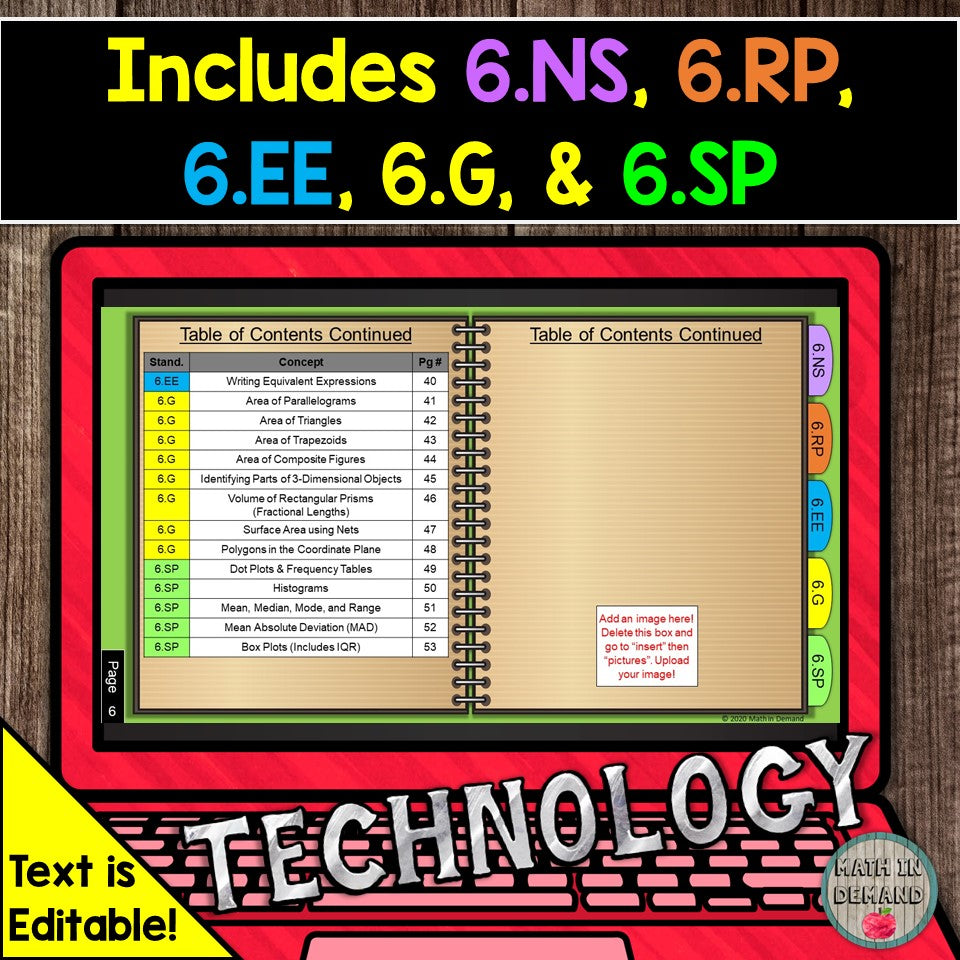
10.) Writing Equivalent Expressions
Unit 4 - Geometry
1.) Area of Parallelograms
2.) Area of Triangles
3.) Area of Trapezoids
4.) Area of Composite Figures
5.) Identifying Parts of 3-Dimensional Objects
6.) Volume of Rectangular Prisms (Fractional Lengths)
7.) Surface Area using Nets
8.) Polygons in the Coordinate Plane
Unit 5 - Statistics & Probability
1.) Dot Plots & Frequency Tables
2.) Histograms
3.) Mean, Median, Mode, and Range
4.) Mean Absolute Deviation (MAD)
5.) Box Plots (Includes IQR)